Creating corporate colour palettes for ggplot2
@drsimonj here to share how I create and reuse corporate color palettes for ggplot2.
You’ve started work as a data scientist at “drsimonj Inc” (congratulations, by the way) and PR have asked that all your Figures use the corporate colours. They send you the image below (coincidentally the Metro UI colors on color-hex.com):

You want to use these colours with ggplot2 while also making your code reusable and flexible.
Outline and setup #
We’re going to create the following:
- Named vector of hex codes for the corporate colors
- Function to access hex codes (in 1)
- Named list of corporate color palettes (combinations of colors via 2)
- Function to access palettes (in 3)
- ggplot2-compatible scale functions that use the corporate palettes (via 4)
Load the ggplot2 package and set a default theme to setup:
library(ggplot2)

theme_set(theme_minimal())
Start with color #
Everything starts with colors. I like to first create a named vector of corporate colors like this:
# drsimonj corporate colors
drsimonj_colors <- c(
  `red`        = "#d11141",
  `green`      = "#00b159",
  `blue`       = "#00aedb",
  `orange`     = "#f37735",
  `yellow`     = "#ffc425",
  `light grey` = "#cccccc",
  `dark grey`  = "#8c8c8c")
Any changes to these colors, or addition of new colors, are done in this vector.
Tip: use back ticks to remove naming restrictions (e.g., to include spaces for `light grey` and `dark grey`).
Next, write a function that extracts the hex codes from this vector by name.
#' Function to extract drsimonj colors as hex codes
#'
#' @param ... Character names of drsimonj_colors
#'
drsimonj_cols <- function(...) {
  cols <- c(...)

  if (is.null(cols))
    return (drsimonj_colors)

  drsimonj_colors[cols]
}
This allows us to get hex colors in a robust and flexible way. For example, you can have all colors returned as they are, specify certain colors, in a particular order, add additional function arguments and checks, and so on:
drsimonj_cols()
#>        red      green       blue     orange     yellow light grey
#>  "#d11141"  "#00b159"  "#00aedb"  "#f37735"  "#ffc425"  "#cccccc"
#>  dark grey
#>  "#8c8c8c"

drsimonj_cols("red")
#>       red
#> "#d11141"

drsimonj_cols("red", "blue")
#>       red      blue
#> "#d11141" "#00aedb"

drsimonj_cols("blue", "red")
#>      blue       red
#> "#00aedb" "#d11141"
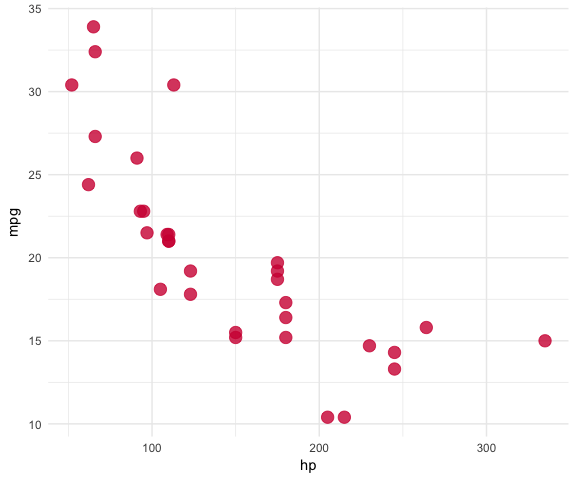
It’s already possible to use these manually in plots like this:
ggplot(mtcars, aes(hp, mpg)) +
    geom_point(color = drsimonj_cols("red"),
               size = 4, alpha = .8)
Combine colors into palettes #
Like all great organisations, drsimonj Inc has a few main colors (let’s say blue, green, and yellow), but the full list (above) includes other official colors used for a variety of purposes. So we can now create palettes (various combinations) of these colors. Similar to how we deal with colors, first define a list like such:
drsimonj_palettes <- list(
  `main`  = drsimonj_cols("blue", "green", "yellow"),

  `cool`  = drsimonj_cols("blue", "green"),

  `hot`   = drsimonj_cols("yellow", "orange", "red"),

  `mixed` = drsimonj_cols("blue", "green", "yellow", "orange", "red"),

  `grey`  = drsimonj_cols("light grey", "dark grey")
)
Changes or new color palettes are added in this list. We write a function to access and interpolate them like so:
#' Return function to interpolate a drsimonj color palette
#'
#' @param palette Character name of palette in drsimonj_palettes
#' @param reverse Boolean indicating whether the palette should be reversed
#' @param ... Additional arguments to pass to colorRampPalette()
#'
drsimonj_pal <- function(palette = "main", reverse = FALSE, ...) {
  pal <- drsimonj_palettes[[palette]]

  if (reverse) pal <- rev(pal)

  colorRampPalette(pal, ...)
}
This function gets a pallete by name from the list ("main" by default), has a boolean condition determining whether to reverse the order or not, and additional arguments to pass on to colorRampPallete() (such as an alpha value). This returns another function:
drsimonj_pal("cool")
#> function (n)
#> {
#>     x <- ramp(seq.int(0, 1, length.out = n))
#>     if (ncol(x) == 4L)
#>         rgb(x[, 1L], x[, 2L], x[, 3L], x[, 4L], maxColorValue = 255)
#>     else rgb(x[, 1L], x[, 2L], x[, 3L], maxColorValue = 255)
#> }
#> <bytecode: 0x7fd7e497ba38>
#> <environment: 0x7fd7e497af78>
This returned function will interpolate the palette colors for a certain number of levels, making it possible to create shades between our original colors. To demonstrate, we can interpolate the "cool" palette (which only includes two colors, green and blue) to a length of 10:
drsimonj_pal("cool")(10)
#>  [1] "#00AEDB" "#00AECC" "#00AEBE" "#00AFAF" "#00AFA1" "#00AF92" "#00B084"
#>  [8] "#00B075" "#00B067" "#00B159"
These hex codes correspond to the following:

This is what we need to create custom ggplot2 scales.
Scales for ggplot2 #
We’ve now got the essentials to create custom color and fill scale functions for ggplot2. There are many ways to do this. I like the approach taken in packages like ochRe. One function is created for color and another for fill, and each contains a boolean argument for the relevant aesthetic being discrete or not. Here are my versions:
#' Color scale constructor for drsimonj colors
#'
#' @param palette Character name of palette in drsimonj_palettes
#' @param discrete Boolean indicating whether color aesthetic is discrete or not
#' @param reverse Boolean indicating whether the palette should be reversed
#' @param ... Additional arguments passed to discrete_scale() or
#'            scale_color_gradientn(), used respectively when discrete is TRUE or FALSE
#'
scale_color_drsimonj <- function(palette = "main", discrete = TRUE, reverse = FALSE, ...) {
  pal <- drsimonj_pal(palette = palette, reverse = reverse)

  if (discrete) {
    discrete_scale("colour", paste0("drsimonj_", palette), palette = pal, ...)
  } else {
    scale_color_gradientn(colours = pal(256), ...)
  }
}

#' Fill scale constructor for drsimonj colors
#'
#' @param palette Character name of palette in drsimonj_palettes
#' @param discrete Boolean indicating whether color aesthetic is discrete or not
#' @param reverse Boolean indicating whether the palette should be reversed
#' @param ... Additional arguments passed to discrete_scale() or
#'            scale_fill_gradientn(), used respectively when discrete is TRUE or FALSE
#'
scale_fill_drsimonj <- function(palette = "main", discrete = TRUE, reverse = FALSE, ...) {
  pal <- drsimonj_pal(palette = palette, reverse = reverse)

  if (discrete) {
    discrete_scale("fill", paste0("drsimonj_", palette), palette = pal, ...)
  } else {
    scale_fill_gradientn(colours = pal(256), ...)
  }
}
Each of these functions specifies a palette, whether the palette is being applied based on a discrete or numeric variable, whether to reverse the palette colors, and additional arguments to pass to the relevant ggplot2 function (which differs for discrete or numeric mapping).
Let’s see them in action.
# Color by discrete variable using default palette
ggplot(iris, aes(Sepal.Width, Sepal.Length, color = Species)) +
    geom_point(size = 4) +
    scale_color_drsimonj()

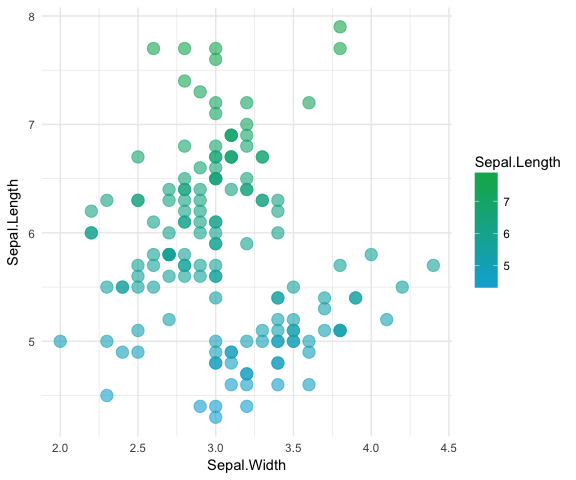
# Color by numeric variable with cool palette
ggplot(iris, aes(Sepal.Width, Sepal.Length, color = Sepal.Length)) +
    geom_point(size = 4, alpha = .6) +
    scale_color_drsimonj(discrete = FALSE, palette = "cool")
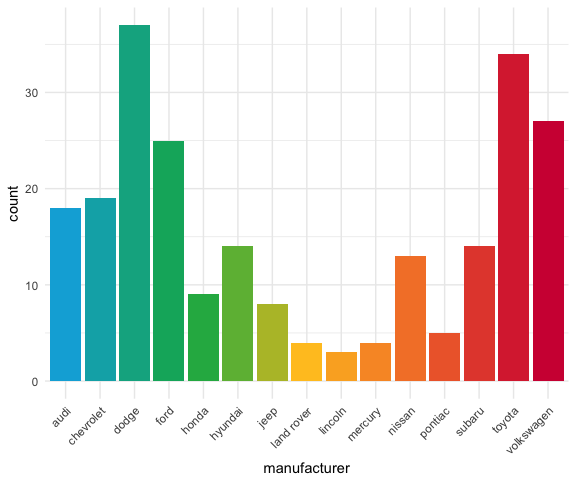
# Fill by discrete variable with different palette + remove legend (guide)
ggplot(mpg, aes(manufacturer, fill = manufacturer)) +
    geom_bar() +
    theme(axis.text.x = element_text(angle = 45, hjust = 1)) +
    scale_fill_drsimonj(palette = "mixed", guide = "none")
Package your work #
A really wonderful next step would be to put all this wonderful code into a package for easy access by you and others. If you’re new to package development, I can’t think of a better resource to get you started than Hadley Wickham’s book, R Packages.
Sign off #
Thanks for reading and I hope this was useful for you.
For updates of recent blog posts, follow @drsimonj on Twitter, or email me at drsimonjackson@gmail.com to get in touch.
If you’d like the code that produced this blog, check out the blogR GitHub repository.