Does financial support in Australia favour residents born elsewhere? Responding to racism with data
Seeing a racist outburst made me wonder whether the Australian Government unfairly supports people based on their background. Using data from the Australian Government and Bureau of Statistics, I couldn’t find compelling evidence of this being true. Don’t believe me? Read on and see what you make of the data.
Australian racism goes viral, again #
Australian racism went viral again this year when a man was filmed abusing staff at Centrelink, which delivers social security payments and services to Australians (see story here). The man yells that he didn’t vote for multiculturalism and that Centrelink is supporting everyone except “Australians”. It is distressing to watch, especially as someone whose ancestors found a home in Australia having escaped persecution. He can’t take it back, but the man did publically apologise and may be suffering from mental illness (see story here).
This topic is still polarising. Many of us want to vilify this man while others may applaud him. But hate begets hate, and fighting fire with fire makes things worse. As a data scientist, the best way I know to respond to the assumptions and stereotypes that fuel racism is with evidence. So, without prejudice, let us investigate the data and uncover to whom the Australian government provides support through Centrelink.
Centrelink supports Australians, so who are we talking about? #
With rare exceptions, Centrelink supports Australian Residents living in Australia (see here and here). So, the claim that Centrelink supports everyone but Australians in misguided. Perhaps the reference to “multiculturalism” can direct us to a more testable question. Centrelink offers support to Australian residents who can be born anywhere in the world. So in this article, I’ll use publically accessible data to investigate differences in support given to residents born in Australia or elsewhere.
Estimated Residential Population #
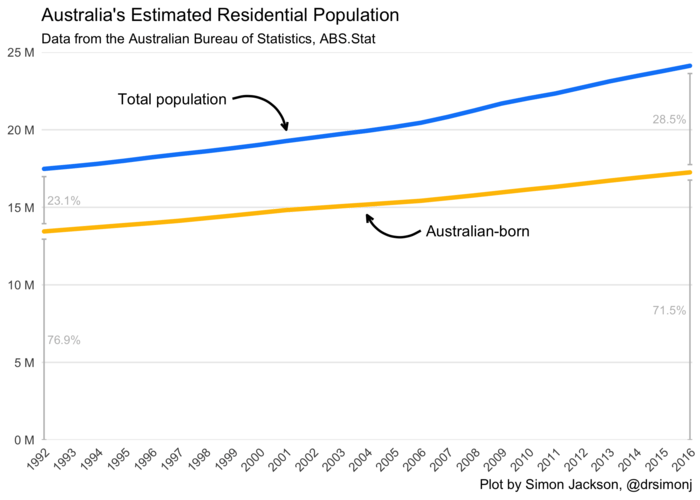
The Figure below shows changes in Australia’s Estimated Residential Population, which is an official value published by the Australian Bureau of Statistics and used for policy formation and decision making.
The residential population has been increasing from about 17 million in 1992 to over 24 million in 2016. In contrast, the percentage of residents who are Australian-born has decreased from 76.9% to 71.5%. This will guide our sense of whether Centrelink payments are unbiased.
As a side note, Census statistics reported that the percentage of Australian-born residents in 2016 was 66.7% (4.8% lower than the official estimate above). This discrepancy is the result of the the Australian Bureau of Statistics making adjustments that you can learn about here.
All Centrelink Payments #
Centrelink data is published quarterly and has included country-of-birth breakdowns since December 2016 (which aligns with the last available population data reported above). At this time, Centrelink made 15 million payments to Australian residents.
In December 2016, 71.5% of Australia’s Estimated Residential population was Australian-born. Comparably, 68.8% of all Centrelink payments went to Australian-born residents.
The data shows that Centrelink payments are made to residents born in Australia or elsewhere in approximately the same proportions as these groups are represented in the population. The difference of a couple of percent indicates that slightly fewer payments were going to Australian-born residents than we’d expect. As we’ll see in the following section, this difference can be almost wholly accounted for by the Age Pension. Still, the difference is small enough to negate the claim that Centrelink substantially favours residents born outside Australia.
Breakdown by Type #
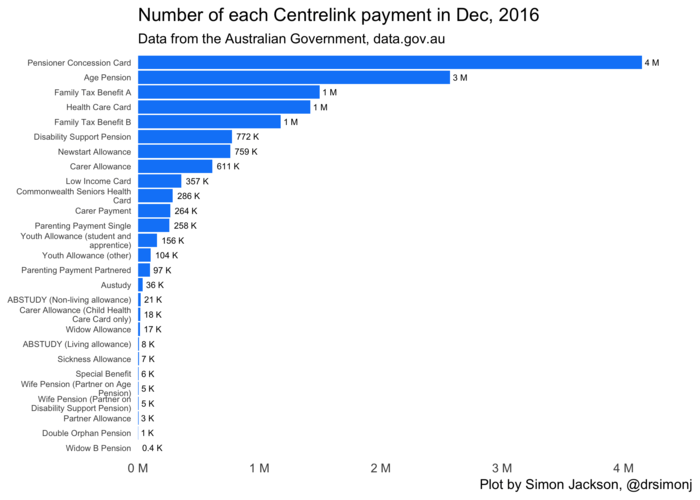
It’s also possible to break down these total numbers into the specific payment types shown below (detailed list here).
It’s expected that these payment types, which support specific needs, will show biases in favour of certain groups. For example, ABSTUDY supports study costs and housing for Aboriginal or Torres Strait Islander residents. This should mostly go to Australian-born residents. To investigate, we can extend the Figure above to include the number of Australian-born recipients:
Looking at this Figure, most Centrelink payments fall along the dotted line, which is what we’d expect from a fair system (if 71.5% of the recipients were Australian-born).
The outlier is the Age Pension, which falls below the line. More recipients of the Age Pension are born outside Australia than is reflected in the total population. I cannot say from this data alone why there is some bias in the Age Pension and perhaps a knowledgeable reader can comment. Nonetheless, this discrepancy is large enough that removing the Age Pension from consideration results in 70.5% of all other Centrelink payments going to Australian-born residents – almost exactly the proportion in the population.
Ignoring Total Numbers #
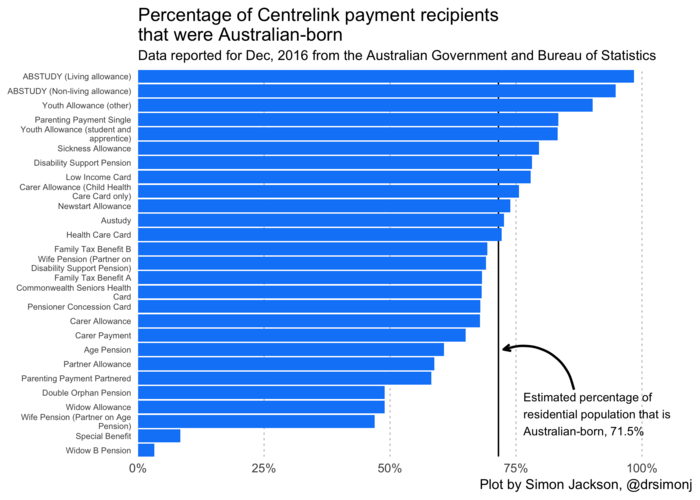
The Figure below shows the percentage of Australian-born recipients for each payment type, ignoring totals.
At the upper end of the scale, we can see Australian-born recipients being over-represented for ABSTUDY and Youth Allowance payments. At the lower end, residents who are born outside Australia are over-represented for Wife and Widow pension and allowance.
These payments with large biases (in either direction) have some common features. They have very specific eligibility criteria and are among the least-awarded services (shown in earlier Figures). Furthermore, the granting of payments to new recipients has been stopped in some cases such as the Wife Pension.
These findings are consistent with the expectation that specific types of payments should be biased in specific ways. It also shows that substantial biases only arise for specific payments that are awarded to very few individuals.
Concluding remarks #
In response to a racist outburst, I sought out publically available data to investigate whether there was evidence that the Australian Government unfairly supported residents based on their country of origin. I found that the percentage of residents born outside Australia has increased over time. However, with the minor exception of the Age pension (which the outraged man was not eligible for), residents born in Australia or elsewhere were fairly represented in the total number of Centrelink payments.
I’d like to thank the Australian Government and Australian Bureau of Statistics for publicising this data and making it possible for me to respond to racism with evidence. If you’d like to reproduce this work or dig into the data yourself, everything from explaining where I got the data to create this article is freely available on GitHub. You can also keep in touch with me on LinkedIn or by following @drsimonj on Twitter.


