focus() on correlations of some variables with many others
Get the correlations of one or more variables with many others using focus() from the corrr package:
library(corrr)
mtcars %>% correlate() %>% focus(mpg)
#> # A tibble: 10 x 2
#>    rowname        mpg
#>      <chr>      <dbl>
#> 1      cyl -0.8521620
#> 2     disp -0.8475514
#> 3       hp -0.7761684
#> 4     drat  0.6811719
#> 5       wt -0.8676594
#> 6     qsec  0.4186840
#> 7       vs  0.6640389
#> 8       am  0.5998324
#> 9     gear  0.4802848
#> 10    carb -0.5509251
Let’s break it down.
Motivation #
I’ve noticed a lot of people asking how to do this: see here, here, here.
So this post will explain how to use focus() from the corrr package to correlate one or more variables in a data frame with many others.
Starting with corrr #
We’ll be using the corrr package, which starts by using correlate() to create a correlation data frame. For example, we can correlate() all columns in the mtcars data set as follows:
mtcars %>% correlate()
#> # A tibble: 11 x 12
#>    rowname        mpg        cyl       disp         hp        drat
#>      <chr>      <dbl>      <dbl>      <dbl>      <dbl>       <dbl>
#> 1      mpg         NA -0.8521620 -0.8475514 -0.7761684  0.68117191
#> 2      cyl -0.8521620         NA  0.9020329  0.8324475 -0.69993811
#> 3     disp -0.8475514  0.9020329         NA  0.7909486 -0.71021393
#> 4       hp -0.7761684  0.8324475  0.7909486         NA -0.44875912
#> 5     drat  0.6811719 -0.6999381 -0.7102139 -0.4487591          NA
#> 6       wt -0.8676594  0.7824958  0.8879799  0.6587479 -0.71244065
#> 7     qsec  0.4186840 -0.5912421 -0.4336979 -0.7082234  0.09120476
#> 8       vs  0.6640389 -0.8108118 -0.7104159 -0.7230967  0.44027846
#> 9       am  0.5998324 -0.5226070 -0.5912270 -0.2432043  0.71271113
#> 10    gear  0.4802848 -0.4926866 -0.5555692 -0.1257043  0.69961013
#> 11    carb -0.5509251  0.5269883  0.3949769  0.7498125 -0.09078980
#> # ... with 6 more variables: wt <dbl>, qsec <dbl>, vs <dbl>, am <dbl>,
#> #   gear <dbl>, carb <dbl>
Introducing focus() #
Once we have a correlation data frame, we can focus() on subsections of these results. For example, to focus() on the correlations of the mpg variable with all other variables, we do:
mtcars %>% correlate() %>% focus(mpg)
#> # A tibble: 10 x 2
#>    rowname        mpg
#>      <chr>      <dbl>
#> 1      cyl -0.8521620
#> 2     disp -0.8475514
#> 3       hp -0.7761684
#> 4     drat  0.6811719
#> 5       wt -0.8676594
#> 6     qsec  0.4186840
#> 7       vs  0.6640389
#> 8       am  0.5998324
#> 9     gear  0.4802848
#> 10    carb -0.5509251
How does it work? #
focus() works similarly to select() from the dplyr package (which is loaded along with the corrr package). You add the names of the columns you wish to keep in your correlation data frame. Extending select(), focus() will then remove the remaining column variables from the rows. This is why mpg does not appear in the rows above. Here’s another example with two variables:
mtcars %>% correlate() %>% focus(mpg, disp)
#> # A tibble: 9 x 3
#>   rowname        mpg       disp
#>     <chr>      <dbl>      <dbl>
#> 1     cyl -0.8521620  0.9020329
#> 2      hp -0.7761684  0.7909486
#> 3    drat  0.6811719 -0.7102139
#> 4      wt -0.8676594  0.8879799
#> 5    qsec  0.4186840 -0.4336979
#> 6      vs  0.6640389 -0.7104159
#> 7      am  0.5998324 -0.5912270
#> 8    gear  0.4802848 -0.5555692
#> 9    carb -0.5509251  0.3949769
focus() gives us all the same syntax as select(). For example, to drop a column (instead of keeping it), we use -, which will then keep it in the rows:
mtcars %>% correlate() %>% focus(-mpg)
#> # A tibble: 1 x 11
#>   rowname       cyl       disp         hp      drat         wt     qsec
#>     <chr>     <dbl>      <dbl>      <dbl>     <dbl>      <dbl>    <dbl>
#> 1     mpg -0.852162 -0.8475514 -0.7761684 0.6811719 -0.8676594 0.418684
#> # ... with 4 more variables: vs <dbl>, am <dbl>, gear <dbl>, carb <dbl>
Or use utility functions like contains():
iris[-5] %>% correlate() %>% focus(contains("Sepal"))
#> # A tibble: 2 x 3
#>        rowname Sepal.Length Sepal.Width
#>          <chr>        <dbl>       <dbl>
#> 1 Petal.Length    0.8717538  -0.4284401
#> 2  Petal.Width    0.8179411  -0.3661259
For the full list of uses, explore ?select.
Working with the results #
Let’s take the case of correlating one variable with all others (e.g., mpg with all others). What should we do? Well, we have a data_frame with two columns:
-
rownamewhich has the names of the other variables. -
mpgwhich has the correlations ofmpgwith the other variables.
With this in mind, one thing we can do is describe various aspects of the correlations within summarise() (also from dplyr package):
mtcars %>% correlate() %>% focus(mpg) %>% summarise(
  n    = n(),
  mean = mean(mpg),
  sd   = sd(mpg),
  min  = min(mpg),
  max  = max(mpg)
)
#> # A tibble: 1 x 5
#>       n       mean        sd        min       max
#>   <int>      <dbl>     <dbl>      <dbl>     <dbl>
#> 1    10 -0.1050454 0.7198517 -0.8676594 0.6811719
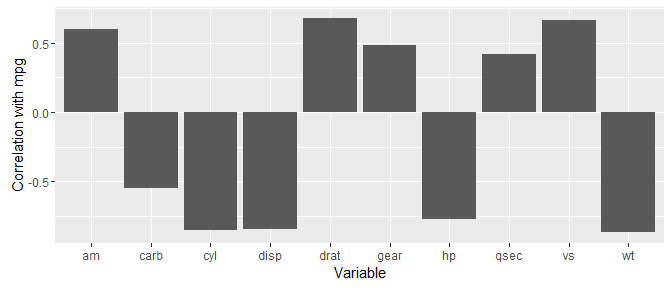
I also like to visualise the correlations. For example, using the ggplot2 package:
library(ggplot2)
mtcars %>% correlate() %>% focus(mpg) %>%
  ggplot(aes(x = rowname, y = mpg)) +
    geom_bar(stat = "identity") +
    ylab("Correlation with mpg") +
    xlab("Variable")
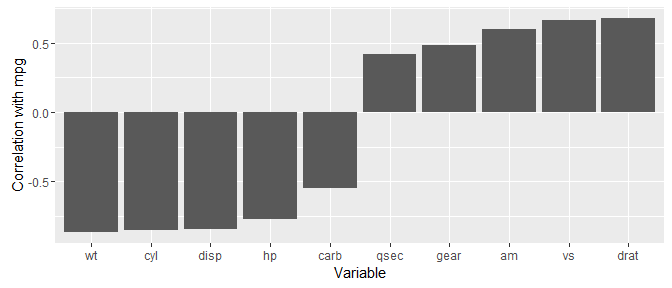
To add to this, we can order rowname by the correlation size in mutate() below:
mtcars %>% correlate() %>% focus(mpg) %>%
  mutate(rowname = factor(rowname, levels = rowname[order(mpg)])) %>%
  ggplot(aes(x = rowname, y = mpg)) +
    geom_bar(stat = "identity") +
    ylab("Correlation with mpg") +
    xlab("Variable")
Extra features #
There are a few additional features to focus() that might help you on occasions.
First, you can keep the remaining columns in the rows (and remove all others) with the mirror = TRUE argument:
mtcars %>% correlate() %>% focus(mpg:drat, mirror = TRUE)
#> # A tibble: 5 x 6
#>   rowname        mpg        cyl       disp         hp       drat
#>     <chr>      <dbl>      <dbl>      <dbl>      <dbl>      <dbl>
#> 1     mpg         NA -0.8521620 -0.8475514 -0.7761684  0.6811719
#> 2     cyl -0.8521620         NA  0.9020329  0.8324475 -0.6999381
#> 3    disp -0.8475514  0.9020329         NA  0.7909486 -0.7102139
#> 4      hp -0.7761684  0.8324475  0.7909486         NA -0.4487591
#> 5    drat  0.6811719 -0.6999381 -0.7102139 -0.4487591         NA
For programmers, there’s also a standard evaluation version focus_(), which behaves like select_().
Sign off #
Thanks for reading and I hope this was useful for you.
For updates of recent blog posts, follow @drsimonj on Twitter, or email me at drsimonjackson@gmail.com to get in touch.
If you’d like the code that produced this blog, check out the blogR GitHub repository.